print("Hello world!")[1] "Hello world!"Basic programming in R and Python and version control with git
Labs can be found here.
We’re going to mostly be doing the precept problem sets during class, but I’ll be posting them as well. If you don’t finish during class, you can finish them on your own time and submit them to the appropriate assignment in 1 week to GitHub Classroom.
This precept is focused utilizing GitHub for version control, which is how we will submit assigments and projects throughout the semester. Learning to use Github is especially important in bioinformatics, because it allows you to more easily work on collaborative projects, document your code, and engage with the bioinformatic community. Github allows you to create a global repository of all your code your code. If you develop a website, it will contain all the code to run your website. If you’re doing a research project, it will contain all the code needed to reproduce your findings. If you’re building a program, it may provide all the code needed to run that program.
We support two IDEs in the course: RStudio and VS Code. I’ll be using RStudio for the early precepts, and VS Code for the later precepts. VS Code is a bit more lightweight and extensible, but RStudio has a lot of nice features specifially for R.
Before going forward, let’s install the basic software we need (you should have done this last week!): R and git.
Make sure that you’re able to run basic R code like the following:
print("Hello world!")[1] "Hello world!"First, you’ll need to create an account on GitHub. You can do that at https://github.com/join.
Finally, you’ll want to connect your global repository on GitHub to the local repository on your computer. The best way to do this is through GitHub Desktop, which can be downloaded at https://desktop.github.com/download/
When you accept the assignment, it will create a global private repository (only visible to BIO331 staff and yourself) that you can use. Once you have that repository, you can clone it to your local machine and start working on it.
To clone the repository, you’ll want to go to your global repository in GitHub, and click on the green code button. Then, you can copy the HTTPS link (usually something like https://github.com/Stonehill-College-Bioinformatics/introduction-to-github-classroom-[YOURUSERNAME].git). In your Github Desktop page, you can then press add repository, clone repository, and enter that link. Once you’ve done that, you’re set up!
For this assignment, you can just create an simple example R file containing some code and text. You can then commit and push your changes to the branch you created.
Running R code: To run R code (in RStudio), you can hit cmd+enter while selecting the line or block of code you want to run (if no line(s) are selected, then just the line that your cursor is on will run). You can also run the entire file by hitting cmd+shift+s or cmd+shift+enter. If you’re working on windows, you can use ctrl instead of cmd. If you’re working on a R Markdown file, you can just click the play button to run “chunks” of code (delineated by 3 ‘`’ symbols followed by curly brackets)
Our goal is to make a simple R file for exploring the iris data set (we’ll explain the structure of this dataset in two labs!).
# ----- Loading and Exploring the iris dataset -----

# Load the dataset -- note that this is a built-in dataset in R
data(iris)

# View the first few rows to understand its structure
head(iris)
Sepal.Length Sepal.Width Petal.Length Petal.Width Species
1 5.1 3.5 1.4 0.2 setosa
2 4.9 3.0 1.4 0.2 setosa
3 4.7 3.2 1.3 0.2 setosa
4 4.6 3.1 1.5 0.2 setosa
5 5.0 3.6 1.4 0.2 setosa
6 5.4 3.9 1.7 0.4 setosa# Check the detailed structure of the dataset for more information on its columns
str(iris)'data.frame': 150 obs. of 5 variables:
$ Sepal.Length: num 5.1 4.9 4.7 4.6 5 5.4 4.6 5 4.4 4.9 ...
$ Sepal.Width : num 3.5 3 3.2 3.1 3.6 3.9 3.4 3.4 2.9 3.1 ...
$ Petal.Length: num 1.4 1.4 1.3 1.5 1.4 1.7 1.4 1.5 1.4 1.5 ...
$ Petal.Width : num 0.2 0.2 0.2 0.2 0.2 0.4 0.3 0.2 0.2 0.1 ...
$ Species : Factor w/ 3 levels "setosa","versicolor",..: 1 1 1 1 1 1 1 1 1 1 ...# Generate summary statistics to get a sense of the data distribution
summary(iris) Sepal.Length Sepal.Width Petal.Length Petal.Width
Min. :4.300 Min. :2.000 Min. :1.000 Min. :0.100
1st Qu.:5.100 1st Qu.:2.800 1st Qu.:1.600 1st Qu.:0.300
Median :5.800 Median :3.000 Median :4.350 Median :1.300
Mean :5.843 Mean :3.057 Mean :3.758 Mean :1.199
3rd Qu.:6.400 3rd Qu.:3.300 3rd Qu.:5.100 3rd Qu.:1.800
Max. :7.900 Max. :4.400 Max. :6.900 Max. :2.500
Species
setosa :50
versicolor:50
virginica :50
# ----- Data Visualization -----

# Scatter plot visualizing the relationship between Sepal measurements
plot(iris$Sepal.Length, iris$Sepal.Width, main="Sepal Length vs Sepal Width",
     xlab="Sepal Length", ylab="Sepal Width", col=iris$Species, pch=16, cex=1.3)
legend("topright", legend=levels(iris$Species), col=1:3, pch=16)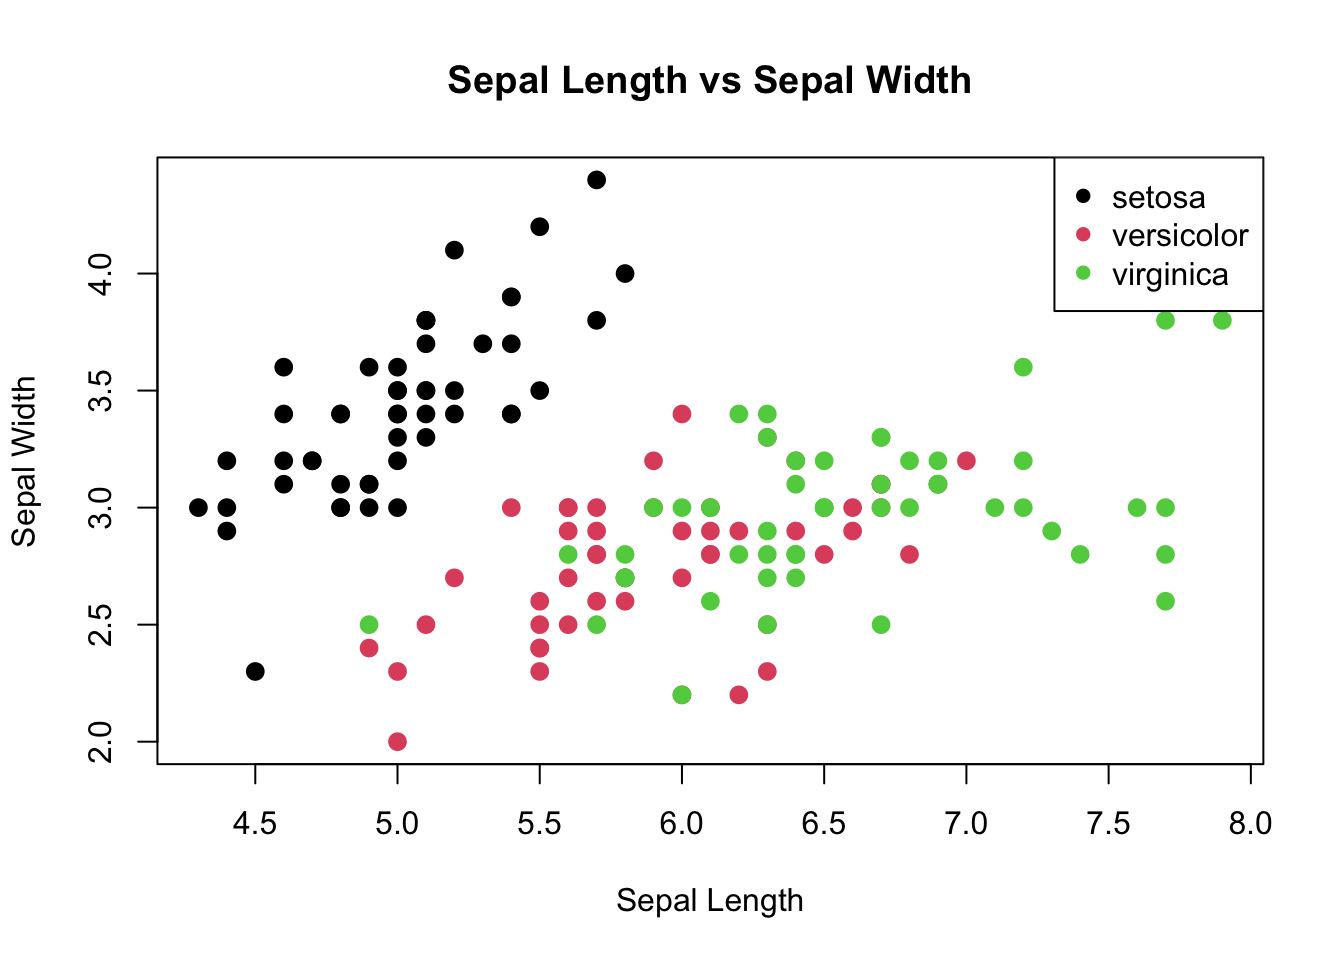
# Scatter plot visualizing the relationship between Petal measurements
plot(iris$Petal.Length, iris$Petal.Width, main="Petal Length vs Petal Width",
     xlab="Petal Length", ylab="Petal Width", col=iris$Species, pch=16, cex=1.3)
legend("topright", legend=levels(iris$Species), col=1:3, pch=16)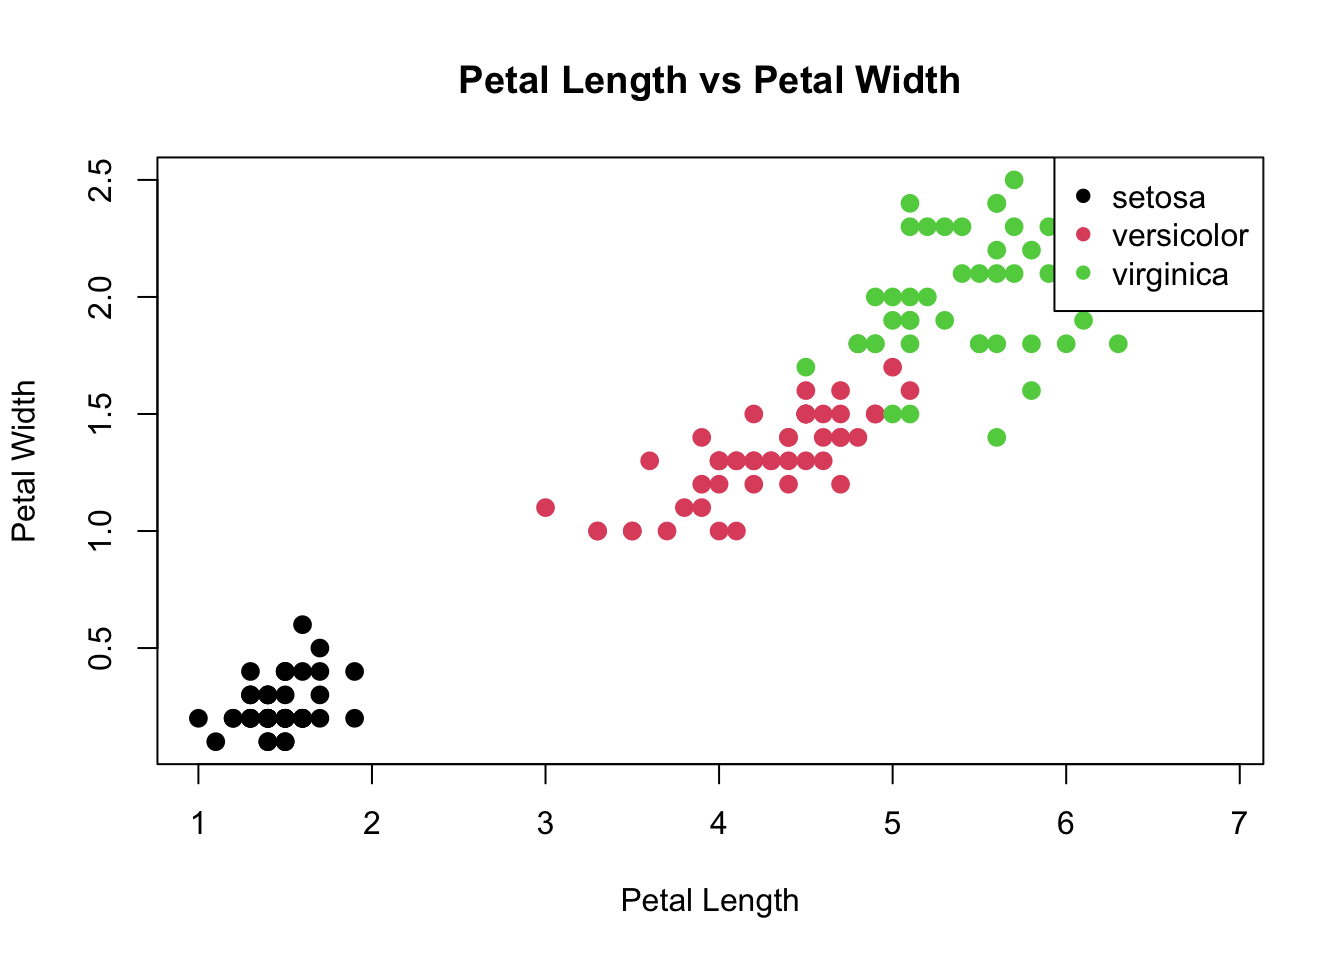
# ----- Modifying the Dataset -----

# Add a new column 'Petal.Length.Class' that classifies flowers based on petal length
iris$Petal.Length.Class <- ifelse(iris$Petal.Length < 2, "Short",
                           ifelse(iris$Petal.Length < 5, "Medium", "Long"))

# View the initial rows of the modified dataset to see the added column
head(iris)
Sepal.Length Sepal.Width Petal.Length Petal.Width Species Petal.Length.Class
1 5.1 3.5 1.4 0.2 setosa Short
2 4.9 3.0 1.4 0.2 setosa Short
3 4.7 3.2 1.3 0.2 setosa Short
4 4.6 3.1 1.5 0.2 setosa Short
5 5.0 3.6 1.4 0.2 setosa Short
6 5.4 3.9 1.7 0.4 setosa ShortOnce you save the new file in your local repository, Github Desktop will notice you have changed your local repository, and give you the option to commit those changes (giving a note saying what you did) and push them (sending the changes to the global repository)
To create a Pull Request on GitHub, you navigate to your branch (under branches on web interface), and select contribute > open pull request.
# Summary

This PR shows example formatting. Because PRs are the primary location at which code is evaluated, make sure that your PRs are clear and descriptive. PRs can include markdown so they can become relatively complex if the assignment is complicated. This should be paired with will documented code to allow others to easily follow your design and implementation.

# Design notes

N/A

# Implementation notes

N/A
WARNING
Be careful here! Please try to only merge PRs when you have completed assignments. If you merge multiple PRs for an assignment, I’ll try to loop back to them if I’ve already graded one, but if I miss them for some reason, please let me know!
For this precept, you’ll just need to make an updated global repository with your changes. I’ll be checking the PRs for the assignment to make sure you wrote something in R.